Loading Solostar Port Energy
Digital twin
Explore the hub before
anything is built.
A conceptual model of the Kandla Port Energy Hub. Toggle layers, switch between the masterplan and the three-dimensional model, move between day and night, and open any zone for its assets, functions and indicative charging specification.
- Zones
- 5 functional zones
- Layers
- 7 independently toggled
- Views
- Site plan · 3D model · day / night
- Status
- Conceptual model, not a survey
Conceptual model · 7 of 7 layers
Select a zone marker for detail · swipe the plan on small screens
Kandla Port Energy Hub · Conceptual
Indicative and future-ready capacities. Final electrical ratings, transformer sizing, and interconnection terms are subject to detailed techno-commercial feasibility study and DISCOM/CEA approval.
Five zones · one energy system
Each zone serves a different duty cycle — from six-hour staff parking to a twenty-minute freight turnaround — but all five draw on the same electrical backbone and the same management layer.
02Energy flow
Where every kilowatt comes from,
and where it goes.
Charging infrastructure without an energy model simply moves the problem to the grid connection. The management layer sits between supply and demand and decides, continuously, what is served and what waits.
SourceManagementStorageLoad
Illustrative Digital Twin SimulationHover or focus any element to read its role and its illustrative indicator. Power paths are drawn in green; the dashed blue paths are operating data returning to the management layer.
Illustrative Digital Twin Simulation. SCADA telemetry values and operational load curves are generated deterministically for demonstration and do not represent measured real-time data from any active facility.
03SOLCOMMAND™
One operating picture for the
entire energy estate.
Charger state, fleet readiness, electrical loading, storage dispatch, commercial settlement and ESG evidence — in a single surface, so that the port's energy system is operated rather than merely monitored.
Demonstration interface
Every figure below is generated for demonstration. Nothing shown is measured data from Deendayal Port Authority or any other port.
Loading command center
24 × 7 port infrastructure
The port does not stop at sunset.
Neither does the energy system.
Freight arrives through the night, security fleets rotate, and the evening tariff peak is when storage earns its place. The night view is not a rendering choice — it is when most of the decisions the platform makes actually matter.
Charger lighting
Bay-level status visible from the lane head, not from a screen.
Canopy lighting
Illumination integrated into the solar structures rather than added to them.
Lane guidance
Drivers directed to an allocated bay instead of queuing for the first free one.
Digital signage
Live queue position, tariff and expected release time at the yard entrance.
Command center
Continuously staffed operations picture across every zone.
Storage dispatch
Storage carries the evening peak so the grid connection does not have to.
04Architectural Visual Programme · 3D Spatial Renders
Ten Spatial Views of the
Port Energy Hub.
Explore photorealistic concept views documenting the electrified hub: from high-power truck charging plazas and containerized BESS storage to captive solar arrays and the central SCADA command center.
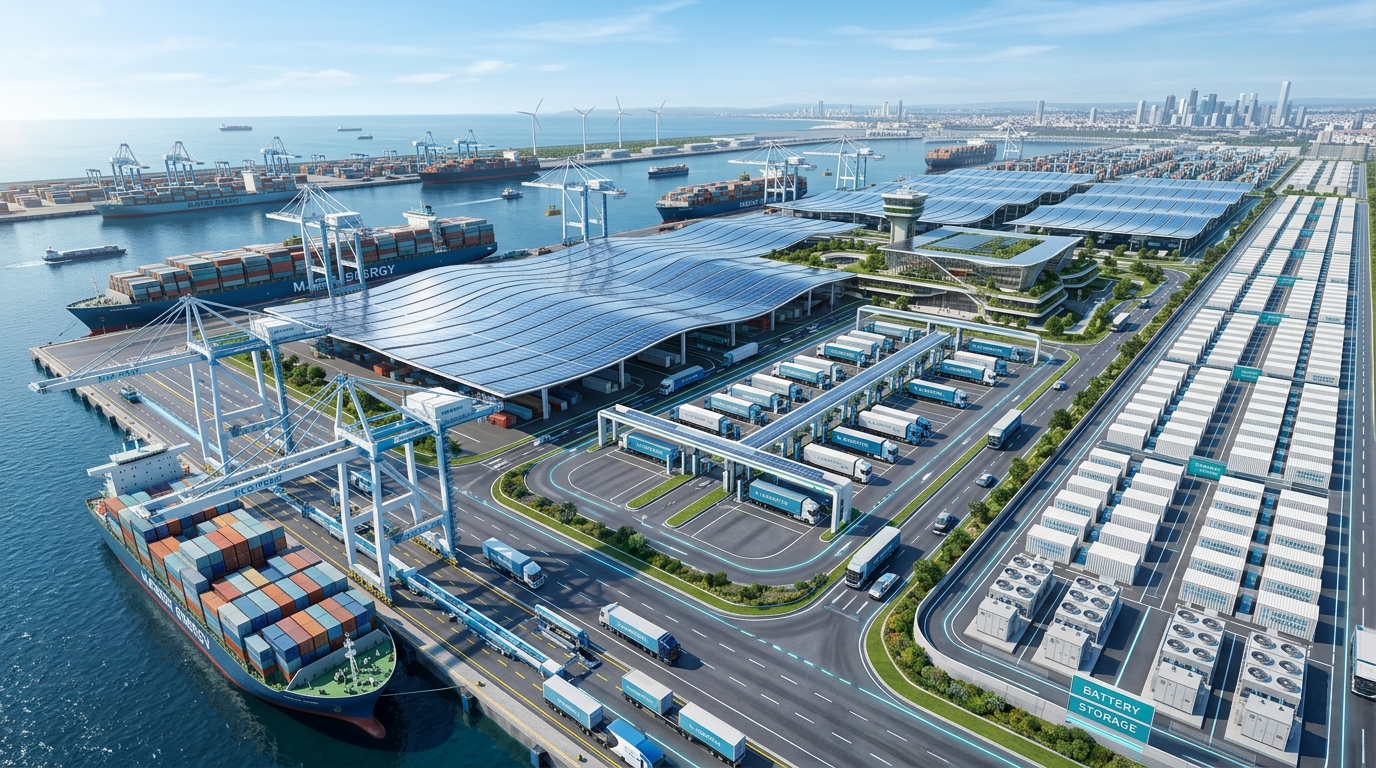
3D Concept ViewAll Zones · Master Port Estate
1.8 GW Integrated Flow · 4.8 MWp PVAspect 21/9
All Zones · Master Port EstateHigh-Res Render
Aerial Masterplan Overview
Full 42-hectare electrified port energy hub in context with deepwater container berths, captive solar canopies, and BESS compounds.
Total Footprint
42 Hectares
Peak Capacity
18.4 MW
CO2 Offset
340k Tons/yr
ID: aerial-overview
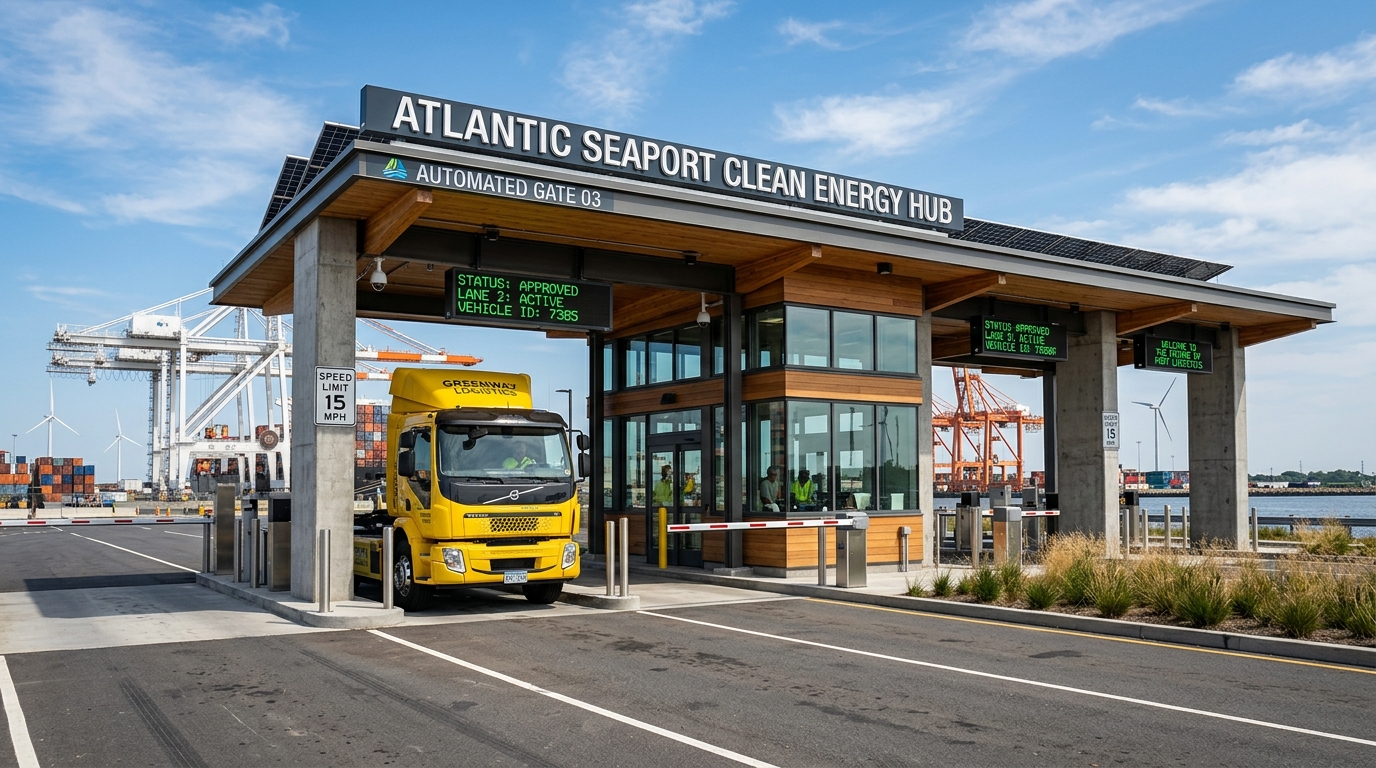
3D Concept ViewZone D · Automated Port Gate 03
ANPR / RFID Access · Dynamic RoutingAspect 16/9
Zone D · Automated Port Gate 03High-Res Render
Automated Drayage Gatehouse
High-throughput access gate with automated optical character recognition, ANPR, RFID access control, and dynamic lane load dispatch.
Lane Speed
15 MPH / 25 km/h
Throughput
180 Trucks/hr
Gate Clearance
<45 Seconds
ID: ground-entrance
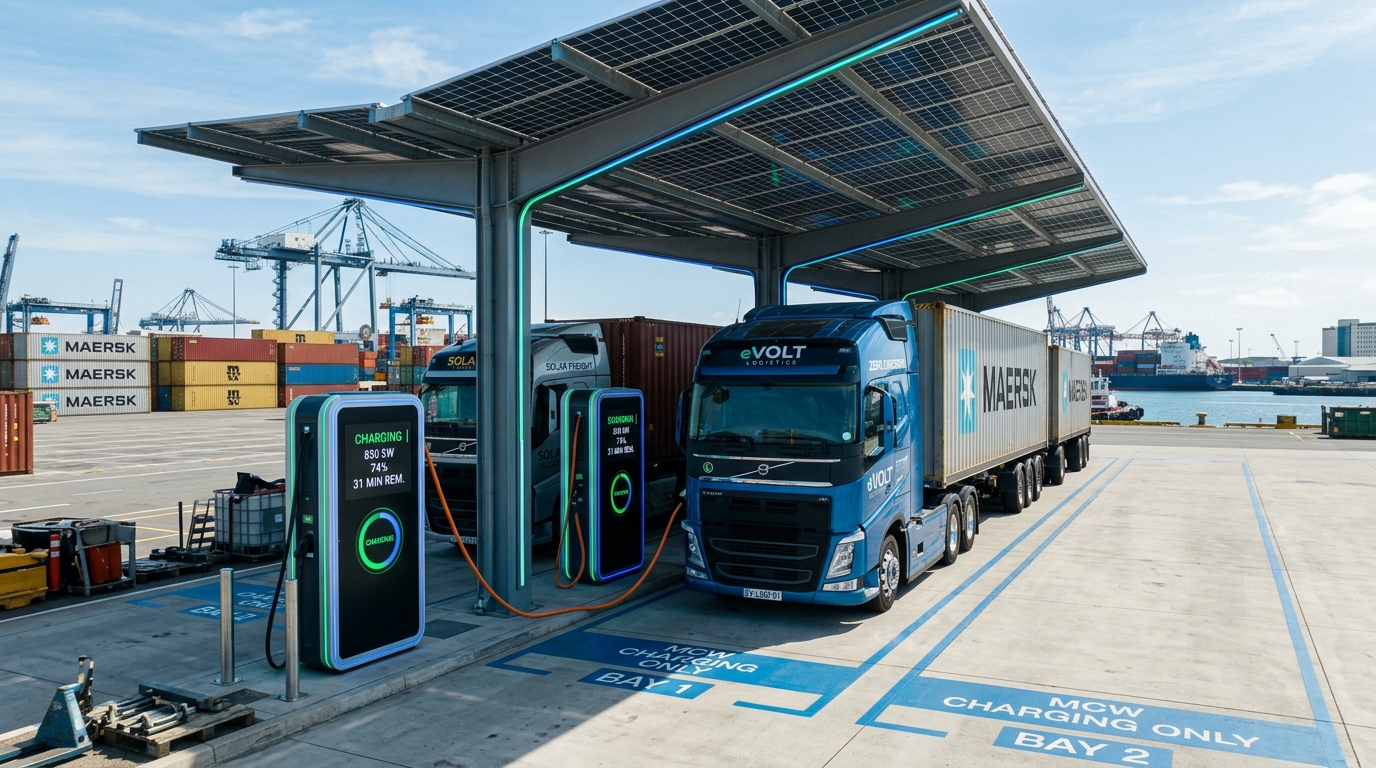
3D Concept ViewZone D · Heavy Drayage Yard
MCS 1 MW+ / 400 kW Dual-Gun CCS2Aspect 16/9
Zone D · Heavy Drayage YardHigh-Res Render
Heavy Truck Megawatt Charging Plaza
Zone D high-power charging lanes supporting 1 MW+ Megawatt Charging System (MCS) and 400 kW dual-gun CCS2 dispensers for Class 8 / multi-axle freight.
Max Output
1,000 kW MCS
Turnaround
25–35 Mins
Lanes
12 Automated Bays
ID: truck-charging
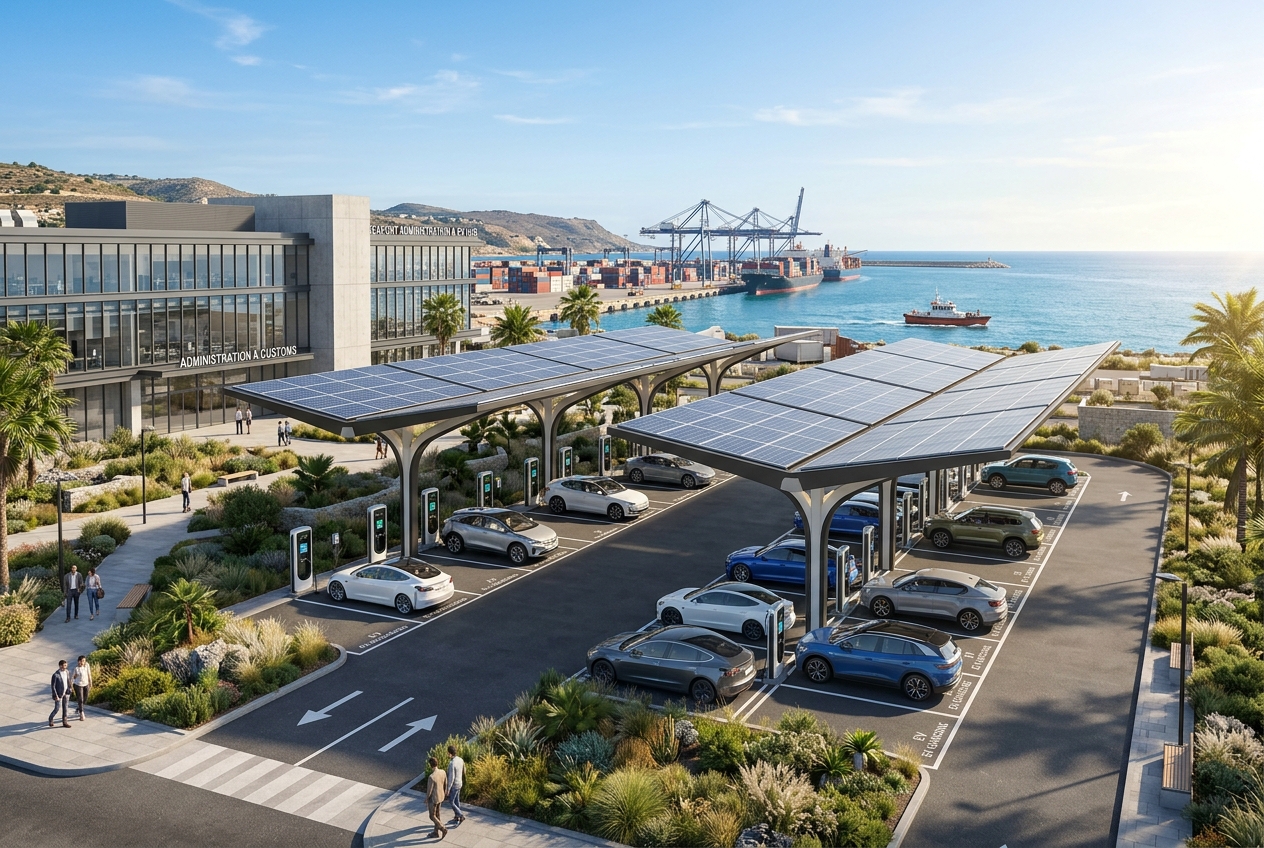
3D Concept ViewZone A · Staff & Admin Fleet
22 kW AC Type-2 / 60 kW DC FastAspect 3/2
Zone A · Staff & Admin FleetHigh-Res Render
Administrative Fleet Charging Court
Zone A cantilevered solar canopy parking court with 22 kW Level 2 AC chargers and 60 kW DC fast units for port authority duty vehicles and pilot cars.
Charging Bays
48 Solar-Canopied
Solar Yield
5.8 kWh/m²/day
Vehicle Types
Port Admin & Customs
ID: staff-charging
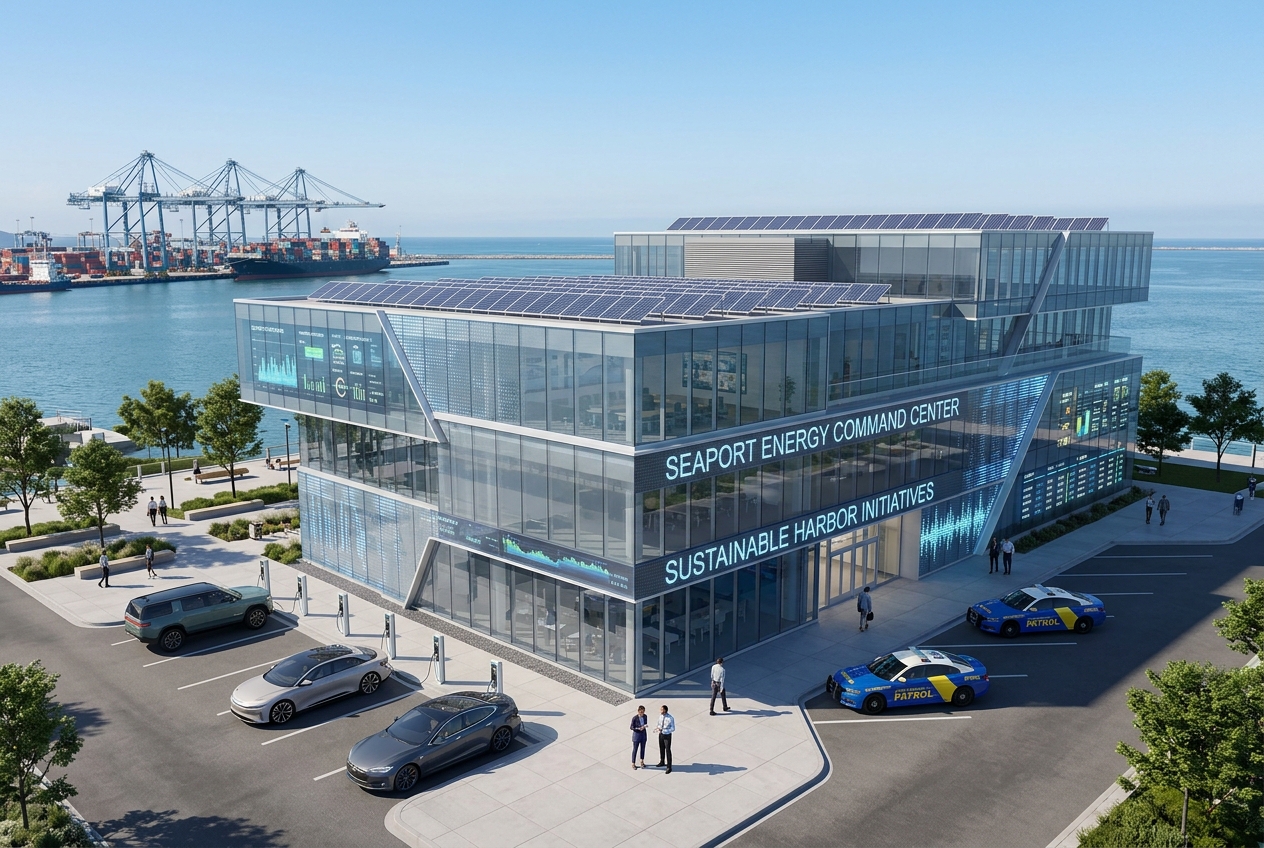
3D Concept ViewZone E · SCADA Operations Center
IEC 61850 / ISO 50001 ArchitectureAspect 3/2
Zone E · SCADA Operations CenterHigh-Res Render
Port Energy Command Center Exterior
Central SCADA building with building-integrated photovoltaics (BIPV), dynamic architectural glass facades, and Tier-III microgrid server infrastructure.
Facility Area
1,850 m²
Rooftop BIPV
380 kWp
Grid Standard
Tier III Microgrid
ID: command-center
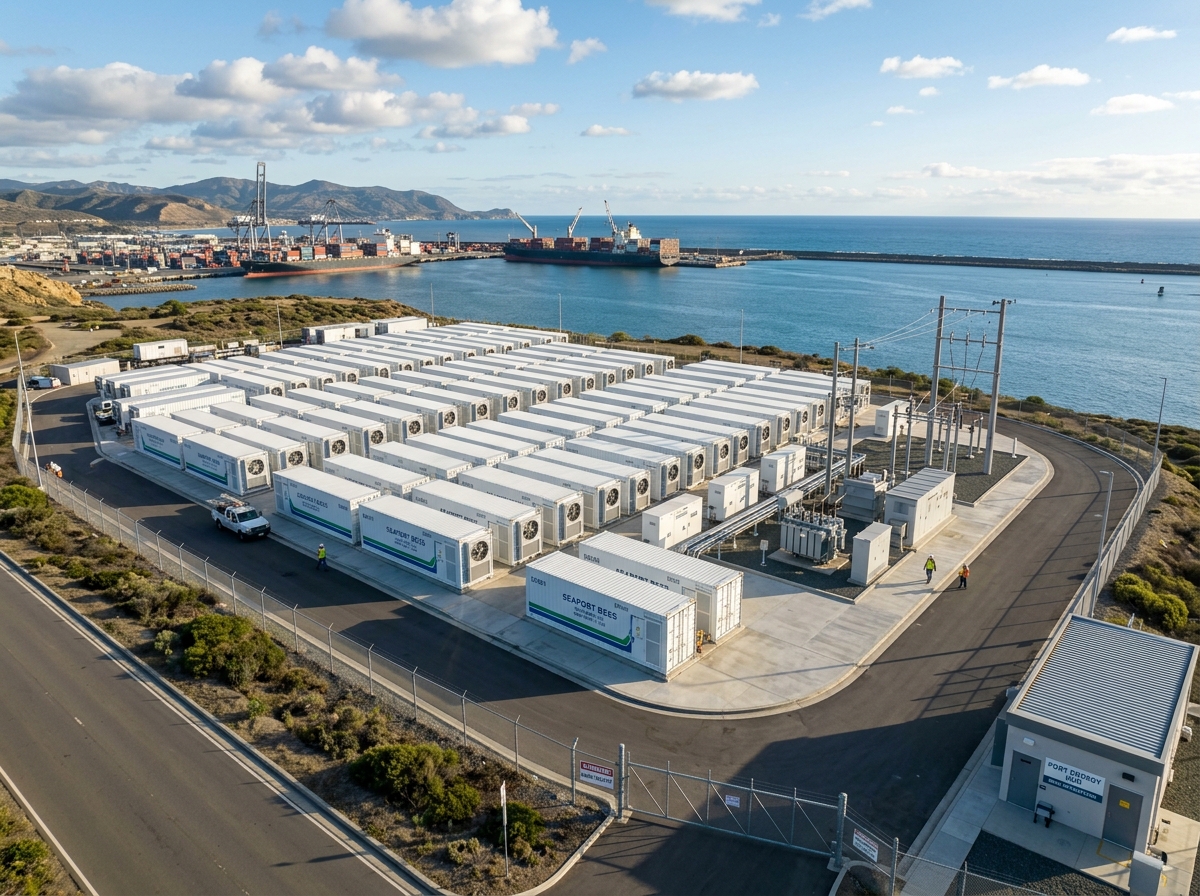
3D Concept ViewZone E · Substation & BESS Yard
15 MWh LFP BESS · 33kV/11kV TransformersAspect 4/3
Zone E · Substation & BESS YardHigh-Res Render
Containerized BESS & Substation Compound
Utility-scale 15 MWh Lithium Iron Phosphate (LFP) battery energy storage system with 33kV/11kV step-up transformers and active liquid thermal management.
Chemistry
LFP (LiFePO4)
Discharge Duration
2–4 Hours (0.5C)
Peak Shaving
100% Demand Mitigation
ID: bess-area
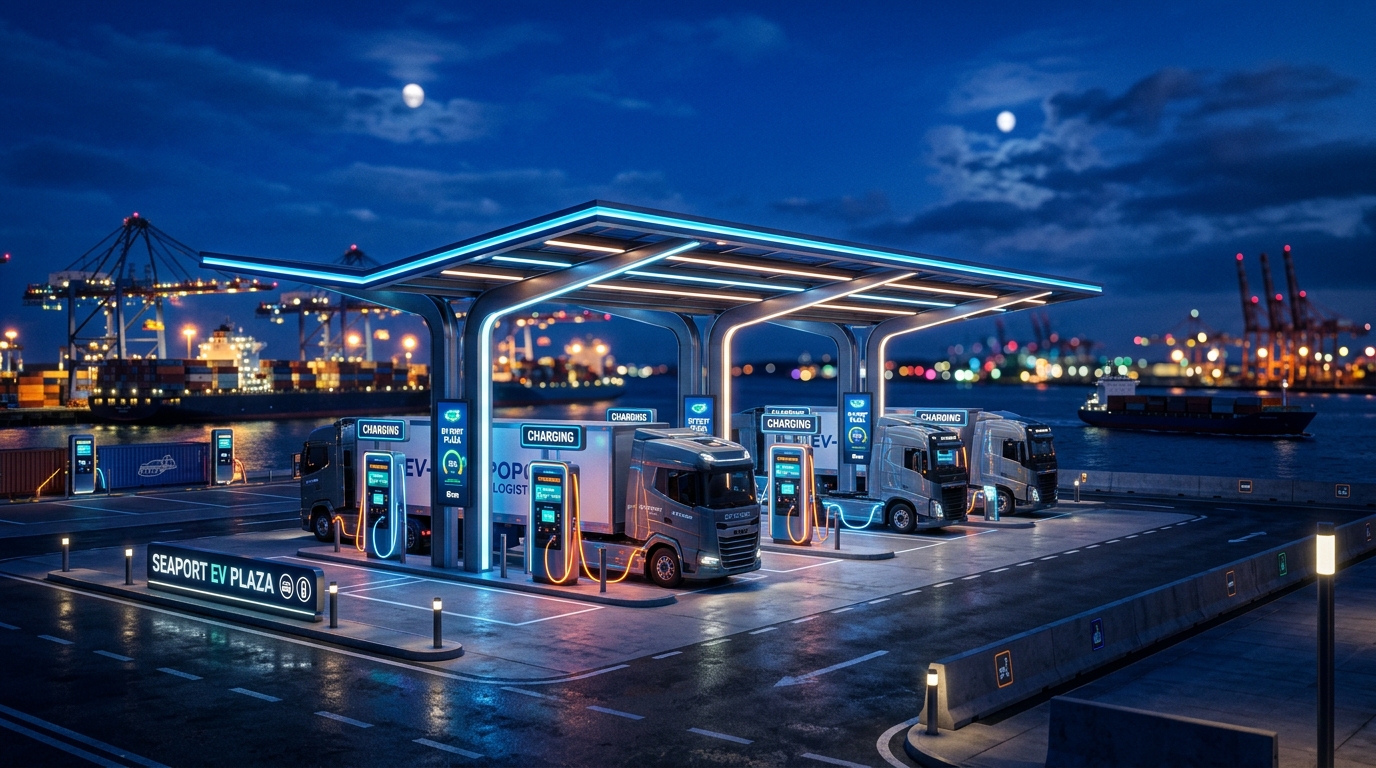
3D Concept ViewZone D & Quay · 24×7 Active Duty
Intelligent Low-Glare LED · Dynamic PeakingAspect 21/9
Zone D & Quay · 24×7 Active DutyHigh-Res Render
24×7 Continuous Night Operations
Illuminated night-shift charging operations with high-efficiency dark-sky compliant LED canopies, optical bay sensors, and autonomous load shedding.
Uptime SLA
99.98%
Night Freight Flow
74 Rigs/hr
BESS Peaking
Automated Dispatch
ID: night-view
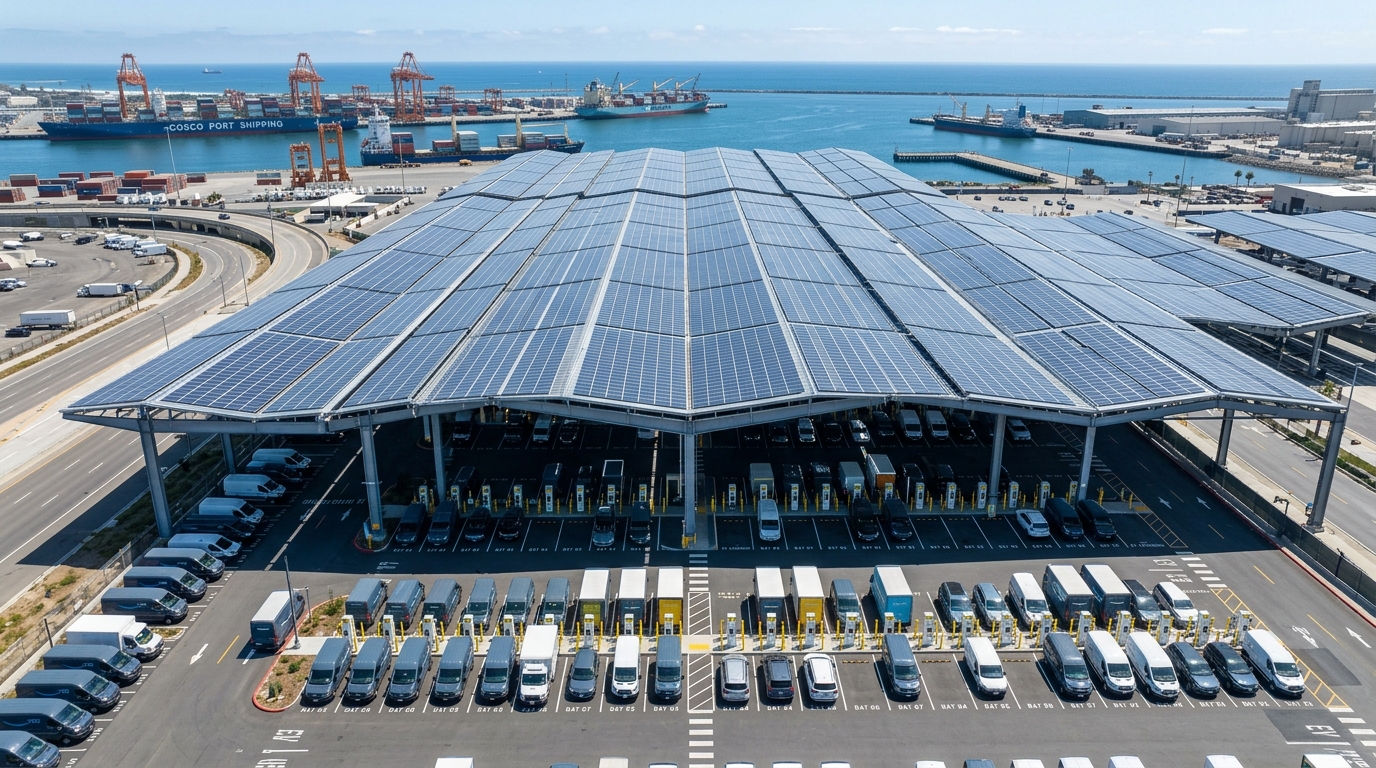
3D Concept ViewZone E & Yard Logistics Canopies
4.8 MWp High-Efficiency MonocrystallineAspect 16/9
Zone E & Yard Logistics CanopiesHigh-Res Render
High-Density Solar Canopy Array
Elevated multi-megawatt bifacial monocrystalline canopy structures engineered for 200 km/h coastal wind gusts while providing equipment shade.
Annual Generation
7,680 MWh/yr
Wind Rating
200 km/h Coastal
Shading Benefit
Truck Cab Heat Deflection
ID: solar-canopy
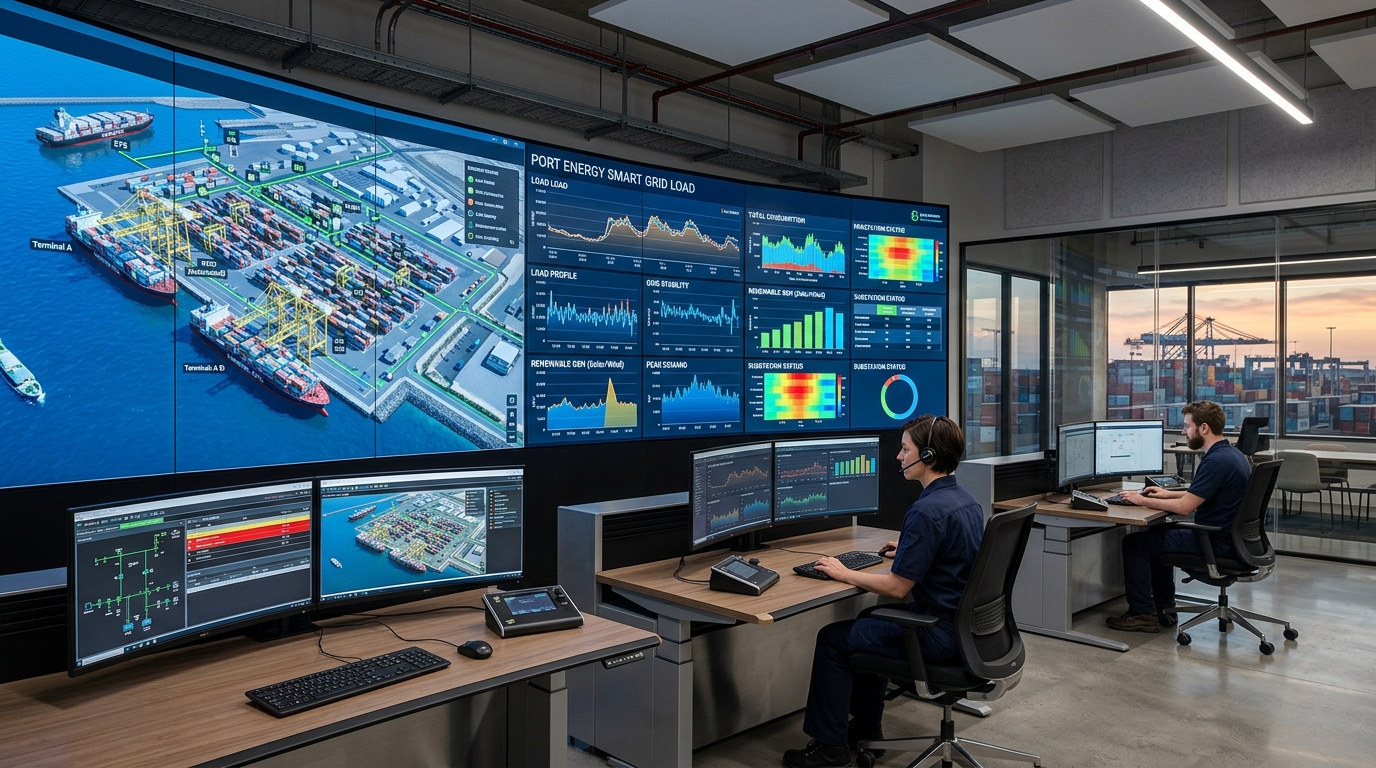
3D Concept ViewZone E · Operations Control Floor
3D Spatial Twin · Sub-Second SCADAAspect 16/9
Zone E · Operations Control FloorHigh-Res Render
SCADA Operations Control Room
Ergonomic operator console floor with curved ultra-high-definition video walls tracking live smart grid load curves, spatial 3D digital twins, and substation breakers.
Telemetry Latency
<22 ms
Endpoints Live
1,420 Active Sensors
AI Optimization
Dynamic Load Balancing
ID: control-room
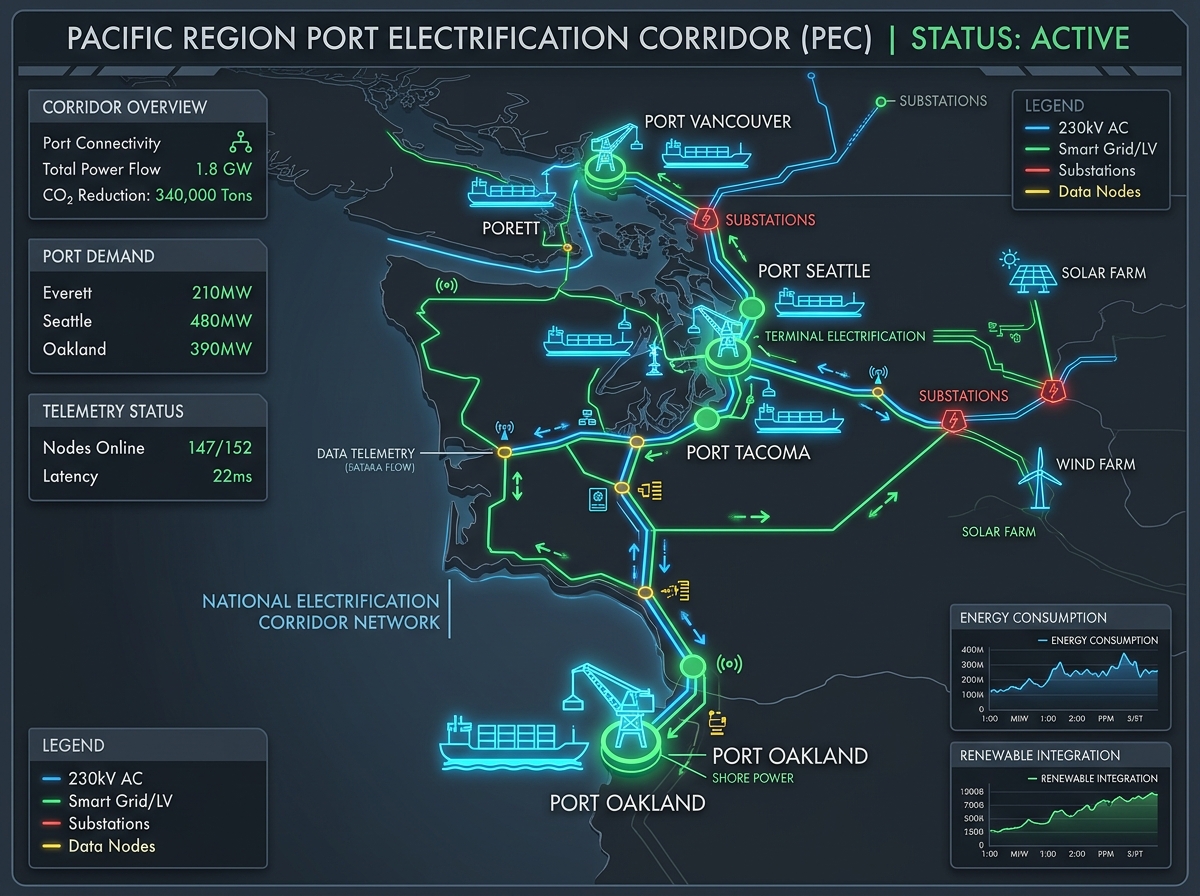
3D Concept ViewInter-Port Freight Network Topology
Harit Sagar 2023 & Maritime Amrit KaalAspect 4/3
Inter-Port Freight Network TopologyHigh-Res Render
National Green Maritime Corridor Topology
High-level schematic showing interconnected deepwater coastal ports, 230kV AC grid feeds, renewable energy nodes, and smart logistics corridors.
Connected Ports
18 Major Terminals
Total Grid Flow
1.8 GW Integrated
National Standard
MoPSW Green Corridor
ID: national-network
Illustrative Digital Twin Simulation. SCADA telemetry values and operational load curves are generated deterministically for demonstration and do not represent measured real-time data from any active facility.
Next step
A model is a conversation starter.
A site assessment is the next step.
The twin reflects a conceptual layout. Turning it into a proposal requires the port's own fleet data, traffic counts, electrical drawings and land constraints.